Measuring the Impact of a New Snow Model Using Surface Energy Budget Process Relationships
26. March 2021
APPLICATE @ vEGU 2021
14. April 2021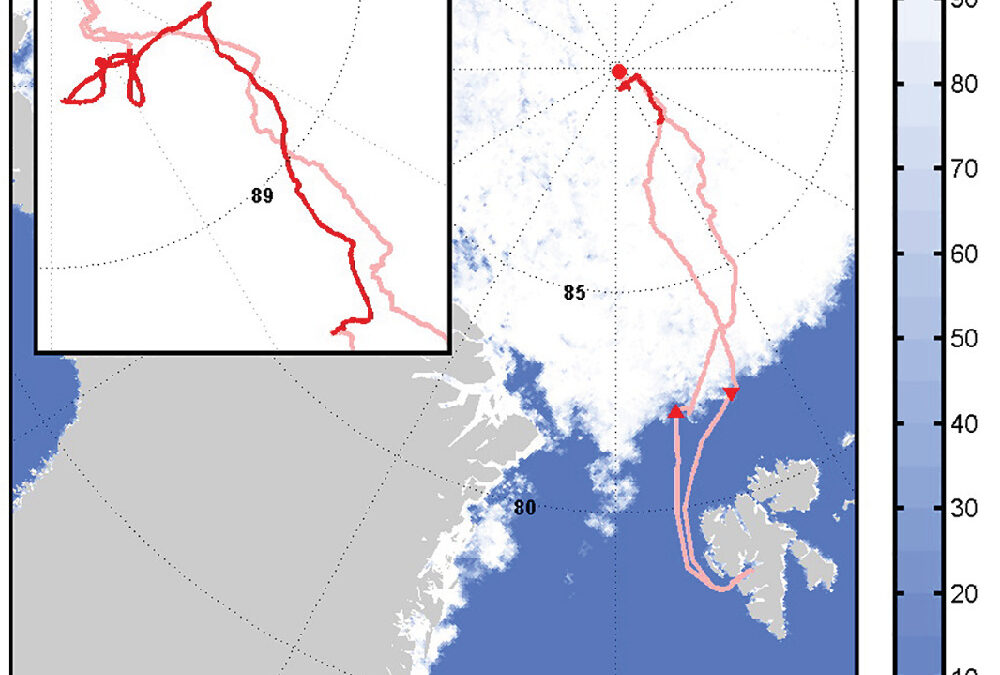
By Mayleen Schlund (AWI) and Michael Tjernström (Stockholm University)
Weather and environmental forecasts are more important than ever since the Arctic is warming at twice the speed as the global average warming and consequently, the sea ice is decreasing in extent, thickness and age. New possibilities for economic activities have arisen and skillful prediction services for the Arctic are needed to manage these opportunities and the risks that come with a growing presence in the region.
Therefore, it is important to evaluate forecast systems in different ways. In their new paper published in the Quarterly Journal of the Royal Meteorological Society, Michael Tjernström et al. compare observational data from the Special Observing Period (Arctic Ocean 2018; AO2018), which took place from 13. August to 14. September 2018, with the Integrated Forecast Systems (IFS) Cy45r2 from the European Centre for Medium-Range Weather Forecasts (ECMWF).
During the AO2018, the research vessel Oden drifted with the sea ice close to the North Pole for one month, across the onset of the surface freeze up, and extensive observations from the Arctic environment had been taken. 6-hourly radio soundings, measurements of winds and surface fluxes from multiple weather stations and of clouds by remote sensing (cloud radar and lidar) recorded various parameters of the Arctic atmosphere, ocean and sea ice to ensure that the initial model error is small. Realistic process models for the Arctic require detailed observations to reduce errors in the models, where vertical structures are very challenging to represent adequately. The authors’ goal is to provide evaluations with useful information for further developments of IFS and new reanalyzes.
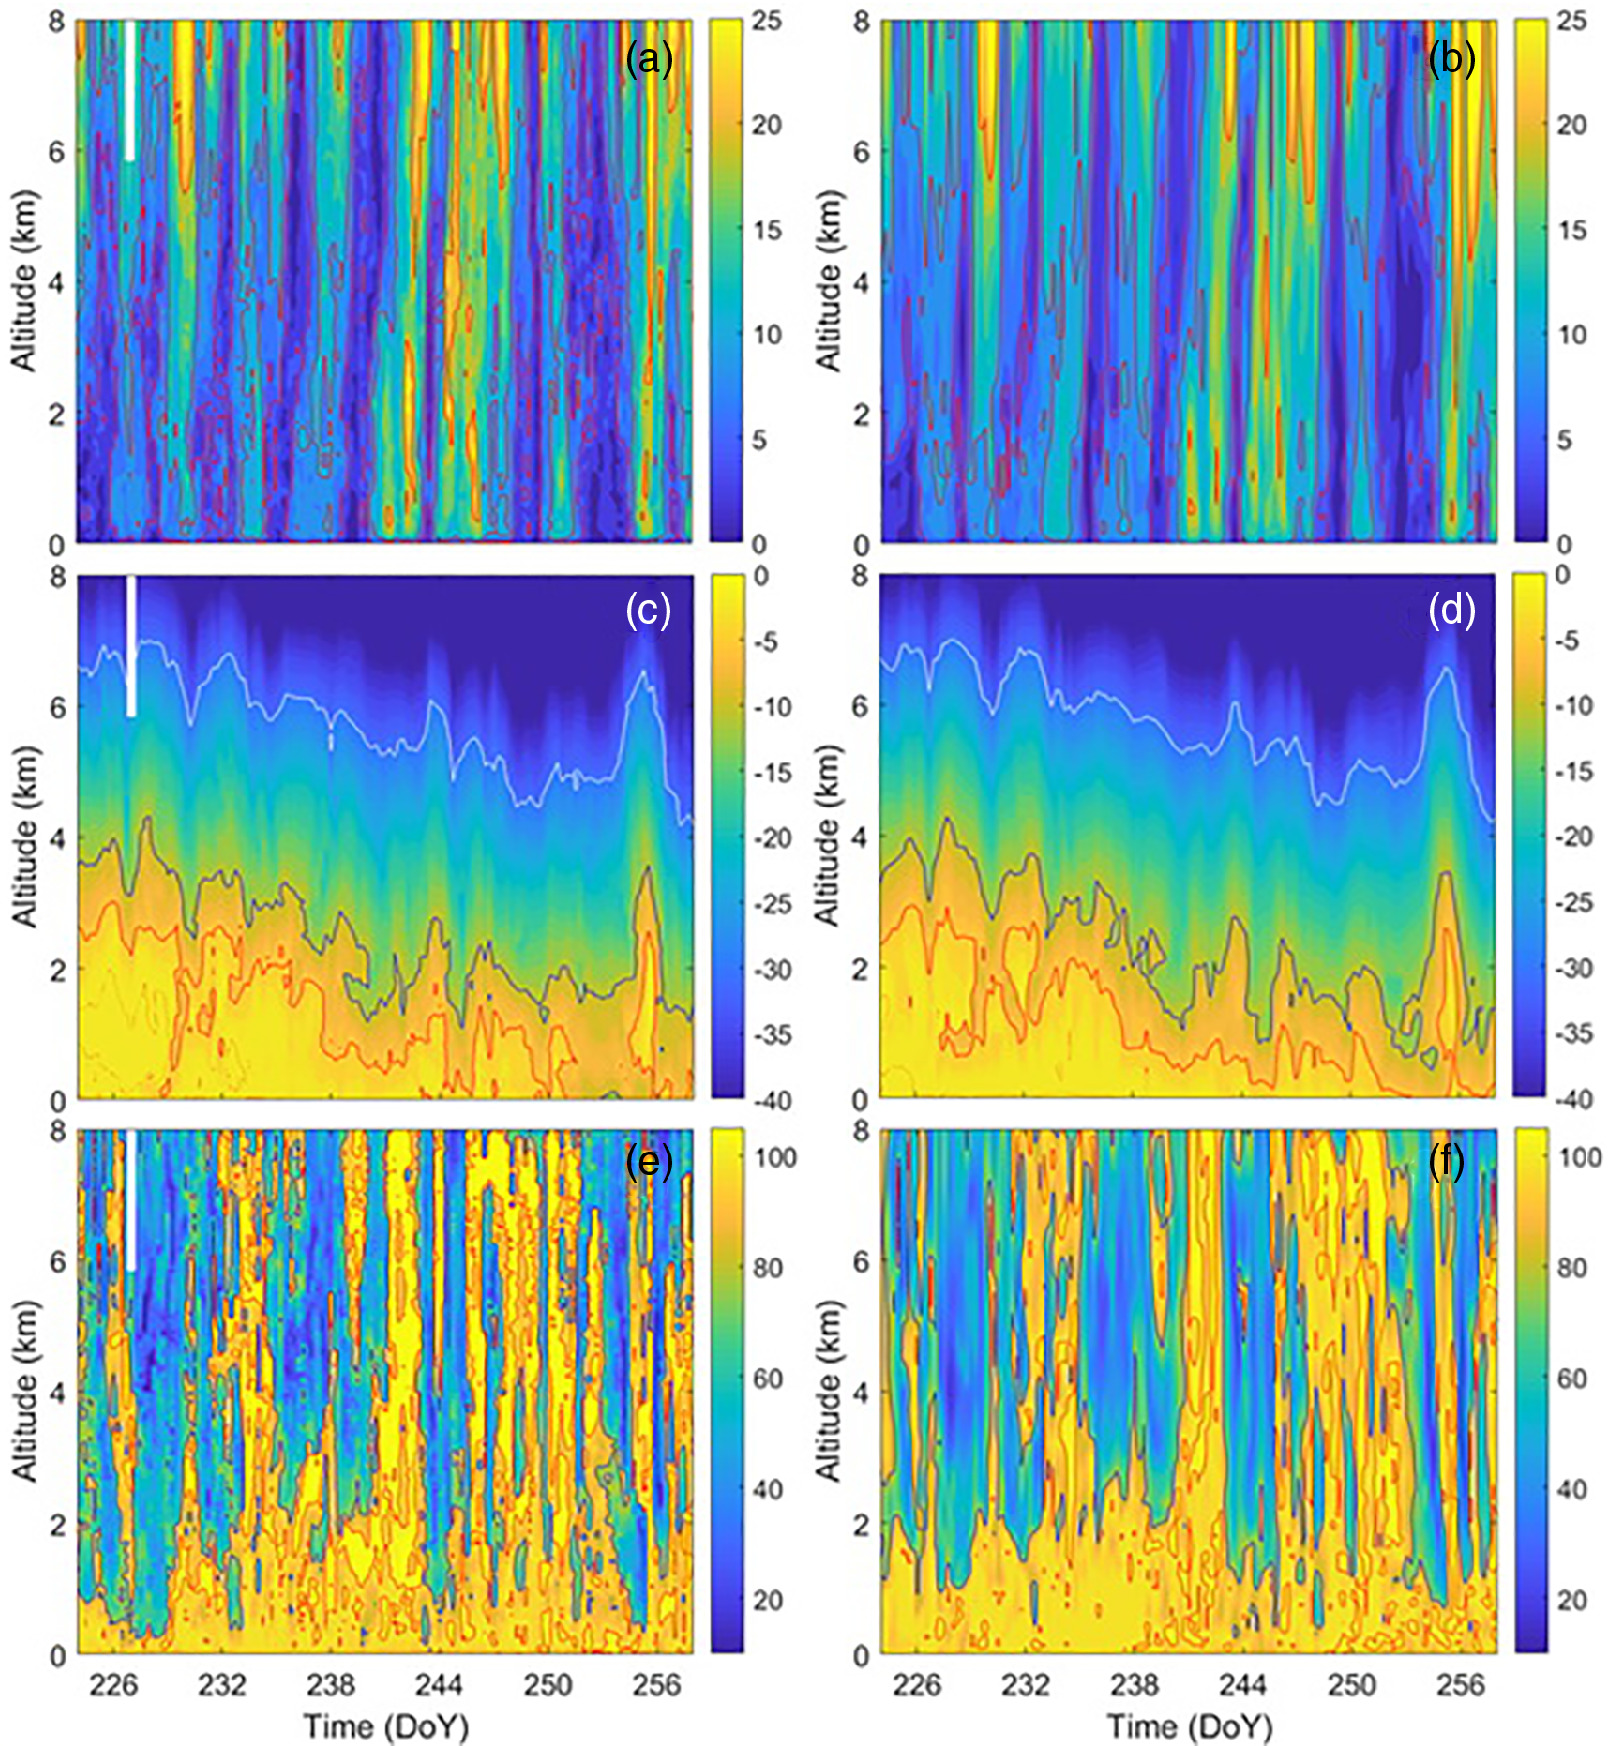
Figure 1: Time–height cross‐sections of (a,b) scalar wind speed (m·s−1), (c,d) temperature (°C), and (e,f) relative humidity w.r.t. ice (%) for the AO2018 ice drift period, with (a,c,e) from observations (radiosoundings) and (b,d,f) from IFS (see the text for a discussion). Contours are also shown: for wind speed at 5, 10 and 20 m·s−1; for temperature at 0, −5, −10 and −30 °C; and for relative humidity at 80 and 100%.
The results of this study show a comparison of the model results Cy41r2 with the observed AO2018 parameters for three-day forecasts initialized every six hours; in total 125 forecasts. The model’s thermodynamical error develops rapidly in the first 6-12 hours and then remains constant; the error spread is also constant. The growth of dynamical variables errors is, however, linear and their error spread also increases with time.
Compared with the observational data, the temperature error shows both vertical and temporal structure. In general, the representation of much of the troposphere in IFS is too cold while the stratosphere is too warm (Figure 1). The most pronounced errors, however, are a systematic boundary-layer warm bias and a cold bias immediately above, with a distinct maximum around 1 km. Turbulent momentum-flux errors are initially small and grow with the wind speed error, while the surface energy budget has two larger systematic errors; an enhanced downwards turbulent sensible heat flux while the incoming solar radiation is too low in the IFS. The main problem, related to the boundary layer being too warm, causes unnaturally warm surfaces. While this error is the largest after the freeze-up has started, it is entirely unphysical during the melt season with temperatures well above the melting point.
Many of these errors seem to come back to one special aspect, highlighted by the results; IFS generally shows too many clouds. Over time this is manifested by a lack of the brief clear periods that were observed and in space, the low clouds are too thick. In particular, clouds below 3 km are too common compared to the observational data while clouds between 3-5 km are too few. It is believed that the large temperature biases in the lower few kilometers are related to the cloud errors; the 1-km cold bias is due to excessive longwave radiation cloud-top cooling and the boundary-layer warm bias due to excessive absorption of solar radiation.
The results have shown that the most errors present in IFS come from the model physics and the description of cloud formation. It is suggested that the too deep and persistent low cloud cover may be connected to the parametrization of mid-level convection, which needs to be reviewed to improved forecast systems. With this study, the relationships of the model physics have been untangled and useful information has been made available to improve and reanalyze observational IFS outputs.
Read the full paper here: Tjernström, M, Svensson, G, Magnusson, L, et al. Central Arctic weather forecasting: Confronting the ECMWF IFS with observations from the Arctic Ocean 2018 expedition. Q J R Meteorol Soc. 2021; 147: 1278– 1299. https://doi.org/10.1002/qj.3971
